

This is a library that make it easy to draw charts in Flutter.
It provides a simple and easy-to-use interface for developers to create beautiful charts for their Flutter applications.
Created by enechain.
🚀 Features
- 📈 Line Chart
🎯 Why use?
- Easy to use: calculates the drawing range and labels automatically, making it easy to use. Of
course, it is also possible to customize which labels to display and the range to use on the user’s side. - Beautiful animation: provides a beautiful animation when drawing the chart by normalizing the
data. - Tooltip customization: provides a tooltip that can be customized to display the data at the
point of the touch.
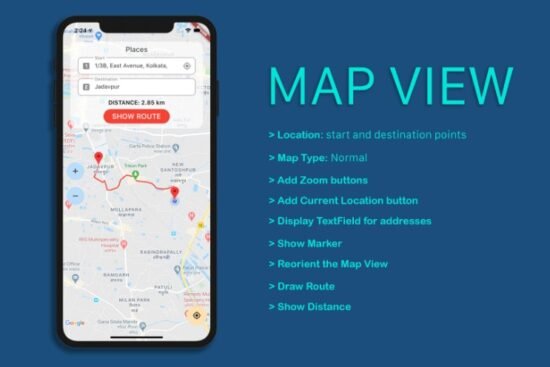
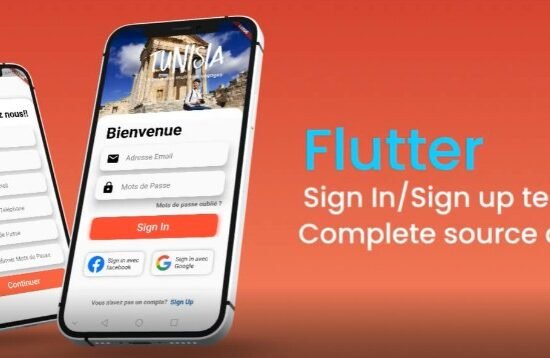
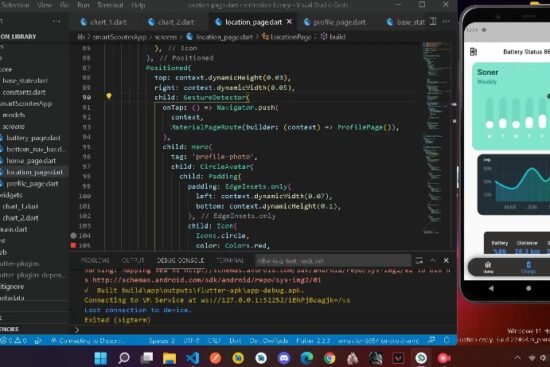
🎬 Sample
|
|
|
🎨 Usage
Please see the example app in the eChart Flutter
Library GitHub repository. The example app includes sample code for creating line charts, as well as
additional customization options.
📄 License
This library is released under the MIT license.